
peakogram
'peakogram' is a script to plot a 2D histogram of peak intensities from SFX data. This plot can be useful for estimating resolution, assessing hit finding parameters, characterizing detector saturation, and other functions.
Listed in Publications
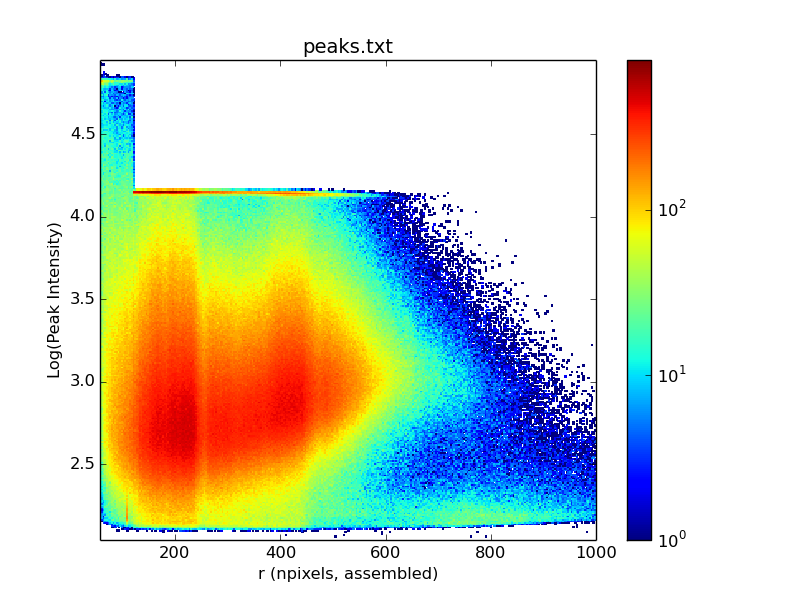
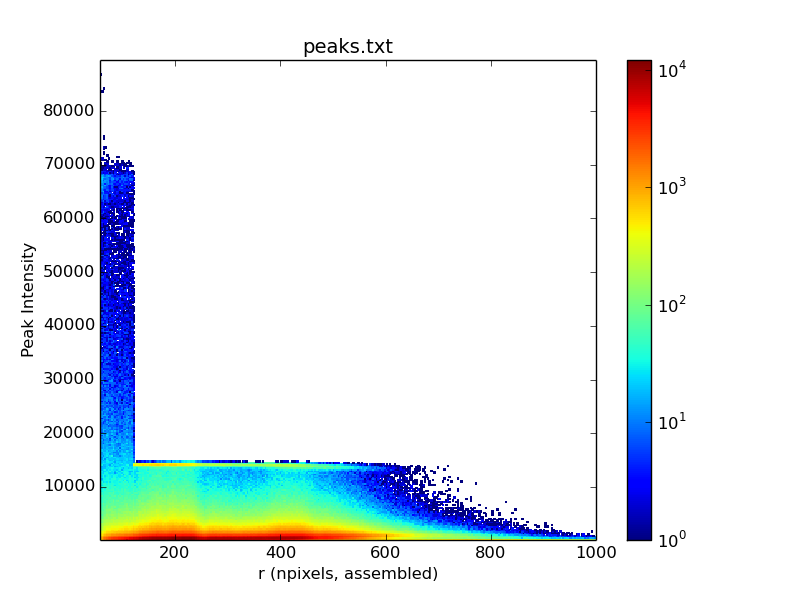
| Abstract | ‘peakogram’ is a script to plot a 2D histogram of peak intensities from SFX data. Using the Cheetah peaks.txt file from hit finding results, it will plot peak intensity as a function of resolution in pixels, binned by the number of peaks. This plot can be useful for estimating resolution, assessing hit finding parameters, characterizing detector saturation, and other functions. By default peakogram can be run with no parameters in a directory containing a peaks.txt file. Otherwise several options are available: usage: peakogram -h I -l RMIN RMAX IMIN IMAX NMAX O optional arguments: -h, —help show this help message and exit -i I peaks.txt file -l log scale y-axis —rmin RMIN minimum pixel resolution cutoff —rmax RMAX maximum pixel resolution cutoff —imin IMIN minimum peak intensity cutoff —imax IMAX maximum peak intensity cutoff —nmax NMAX maximum number of peaks to read -o O output file prefix |
|---|


